PC-Plod Analysis
 Data entered into PC-Plod is retained in the database until eventually purged several years later. 95% of this data is from Plod Sheets and has been used to raise your invoices and pay your staff – so you can be confident it is both accurate and complete.
PC-Plod provides a number of tools that allow you to use this valuable historical resource for analysis and management purposes.
Screen Enquiries
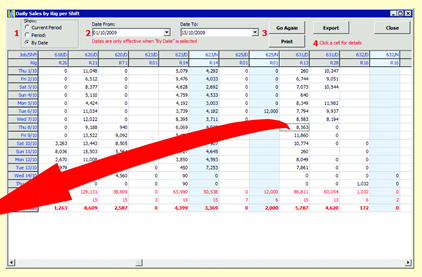
A number of screens will provide a quick answer. This one ($ x Rig/Shift) shows one column for each Rig at each Job, with Day and Night Shifts shown separately, so each cell represents total income for a Rig/Shift:
 |
|
|
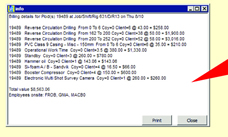
| You can click on a cell to see how that income is made up: |
 |
|
 |
|
Formal Reports
A number of reports are designed to give a quick snapshot of recent or historical data. eg: Rig Usage, Drillers Analysis, Sales by Job, PlodTrans, etc.
All reports appear as Previews on the screen (quite often you just want to see the answer, not necessarily print it). From the Preview you can print a hard copy(s) or save it in one of several file formats including PDF (suitable for emailing) and TXT (suitable for opening in Excel and the like).
Freeform
This facility allows you to interrogate the database and design your own reports which can be printed or exported.
Data Mining "sniffers"
PlodSniffer, PlodSniffAll, TrainSniffer and HoursSniffer are very versatile “data-mining” tools which allow you to “drill down” and isolate whatever you may be interested in:
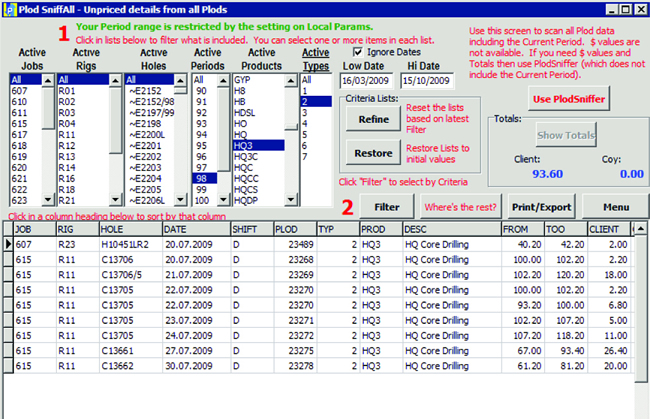
This screen shows all the HQ3 Drilling that happened during Period 98.
We can see there is a total of 93.60 metres that was all charged to the Client. What we see in the bottom half of the screen are the relevant Plod line-item details which reveal Job, Rig, Plod, Date, etc. If appropriate we could print or export these details; or we could drill down further by clicking on a Job or Rig or Hole in the selectors at the top of the screen.
Drillers Analysis
This allows you to analyse the production performance of selected or all drillers in terms of metres drilled, by drilling type, and by invoiced value. You can print in summary or detail form for one or any number of periods.
The example below is telling us that Daniel Kersway worked three Shifts in Period 79. Each of these Shifts averaged 34.37 Diamond Metres and included 3.5 Chargeable Hours, with an average invoice total value per Shift of $6,358. Using $value as the criteria Daniel ranked 8th out of the 12 DR1s analysed for the Period.
Rig Activity
What is Rig Activity?
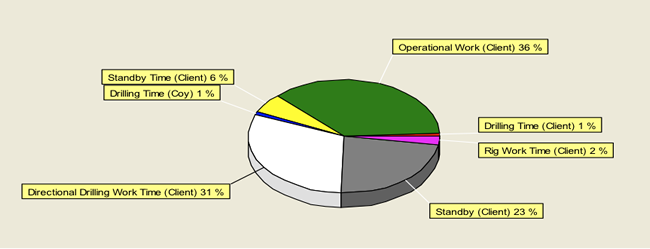
During the course of a 12 hour Shift it is unlikely that the Rig will be actually drilling, as such, for all 12 hours. It could be involved in related tasks such as Pulling Rods, or Moving Site, or even be idle for non-productive tasks such as BreakDown, or Toolbox Meeting, or Standby waiting for direction from the geologist, or whatever.
From time to time you or your customers may wish to know what the Rig(s) were actually doing over a period of time. If a Rig is supposedly capable of drilling, say, 3 metres per hour then your customer may ask why you are not achieving 40 metres per Shift. This is considering Rig Activity in terms of HOURS.
Or you may wonder “What kind of drilling have my Rigs been up to? In what proportions? How do they compare one to another?” This is considering Rig Activity in terms of METRES.
Plod’s Rig Activity feature allows you to quickly prepare a graph that answers these questions.
What does Rig Activity do?
Plod’s Rig Activity feature assembles statistical data from your database and presents this as:
- A graph (as above). You can copy/paste this into Word or other applications.
- A statistical file which can be printed as a report, or exported to Excel for further analysis and printing.
Plod is very versatile in the way you can use Rig Activity for analytical purposes. Your request may be as simple as “What did R23 do between 1/5/2012 and 15/5/2012”, or something more devious such as “Show me how much Standby applied to each Job during March 2012” or “Show the proportion of Breakdown by Rig for the past six months” or “Which Rigs did the most PQ Drilling over the last year?”